
-
93k Accesses
-
26 Citations
This article was retracted on 23 August 2023
This article has been updated
Abstract
This article reviews recent bibliography on time series of some extreme weather events and related response indicators in order to understand whether an increase in intensity and/or frequency is detectable. The most robust global changes in climate extremes are found in yearly values of heatwaves (number of days, maximum duration and cumulated heat), while global trends in heatwave intensity are not significant. Daily precipitation intensity and extreme precipitation frequency are stationary in the main part of the weather stations. Trend analysis of the time series of tropical cyclones show a substantial temporal invariance and the same is true for tornadoes in the USA. At the same time, the impact of warming on surface wind speed remains unclear. The analysis is then extended to some global response indicators of extreme meteorological events, namely natural disasters, floods, droughts, ecosystem productivity and yields of the four main crops (maize, rice, soybean and wheat). None of these response indicators show a clear positive trend of extreme events. In conclusion on the basis of observational data, the climate crisis that, according to many sources, we are experiencing today, is not evident yet. It would be nevertheless extremely important to define mitigation and adaptation strategies that take into account current trends.
1 Introduction
The average surface temperature of our planet has increased by about one degree centigrade from the pre-industrial era and various studies highlight variations in cloud cover, precipitation, relative humidity and wind speed. This article reviews recent bibliography on some extreme weather events by comparing them with time series in order to understand whether an increase in intensity and/or frequency is found.
Following the IPCC AR5 definition [1], extreme weather events are events rare at a particular place and time of the year. Definitions of rare event vary, but an extreme weather event would normally be as rare as or rarer than the 10th or 90th percentile of a probability density function estimated from observations. When a pattern of extreme weather persists for some time, such as a season, it may be classified as an extreme climate event, especially if it yields an average or total that is itself extreme (e.g. drought or heavy rainfall over a season).
The extreme weather events subject of this discussion take place within the climate system, a system of great complexity that includes five subsystems (atmosphere, cryosphere, lithosphere, hydrosphere and biosphere) and which has as its fundamental elements the energy balance between photons arriving from the sun and photons re-emitted to space, the greenhouse effect and atmospheric and oceanic circulation. The climate system is set in motion by the energy imbalance originating from the latitudinal and seasonal variation of solar energy arriving at the ground and which activates the atmospheric and oceanic circulations responsible of the latitudinal and zonal energy redistribution. For more details, please consult the didactic paper and to the report presented at the 2020 SIF congress by one of the authors [2, 3].
2 Observations of extreme weather events
Speaking of extreme weather events, it is important to underline the difference between statistical evidence of excess of events, with given characteristic, and probabilistic calculation of anthropogenic attribution of extreme events: the two aspects have very different epistemological status.
While the statistical evidence is based on historical observations and tries to highlight differences between these and recent observations or possible trends as a function of time, the anthropogenic versus natural attribution of the origin of a phenomenon is based on probabilistic models and makes reliance on simulations that hardly reproduce the macro- and microphysical variables involved in it. For example, the wind speed measured by surface land weather stations during 1973–2019 shows a trend slightly negative for all regions of the world in frequency of extreme winds (speed > 10 m/s). Among possible causes are reported changes in large-scale atmospheric circulation, increase of surface roughness, instrumentation changes, different measurement time intervals, air pollution and an increase of the spatial variance in near-surface air temperature [4]. The possible causes are occurring at different scales and the mechanisms behind them likely vary spatio-temporally, which makes the attribution very uncertain. Moreover, Zeng et al. [5] concluded that the relationship of ocean–atmosphere oscillations to anthropogenic warming and the impact on surface wind speed variability remains unclear, representing a large scientific challenge.
The confidence in observations of extreme events depends on the quality and quantity of data, which vary between regions of the globe and for different types of extreme events and weather variables. In this regard, it is first of all necessary to underline the difficulty in finding reliable time series of global data: often we have to limit ourselves to more local observations carried out in those areas where historically the phenomena have been better observed and recorded and whose data are therefore more reliable and representative.
Overall, as reported by the IPCC [6], the most robust global changes in climate extremes are found in daily temperature measurements, including heat waves. The global analysis carried out by Perkins-Kirkpatrick and Lewis [7] showed for the period 1951–2017 a significant increase in yearly values of heatwave days, maximum heatwave duration and cumulative heat, while the global heatwave intensity trends are not significant. Precipitation extremes also appear to be increasing, but there is great spatial variability and trends observed in droughts are still uncertain except in some regions. Apparent strong increases in the frequency and activity of tropical cyclones in the North Atlantic have been observed since the 1970s. There is limited evidence of changes in extremes associated with other climate variables since the mid-twentieth century.
While the increase in the frequency and persistence of heat waves can easily be explained by increasing global temperatures, the observed increase in tropical cyclones in the North Atlantic, as well as having unclear reasons as claimed by the IPCC [6], seems to be a local phenomenon and substantially due to better reporting as supported by NOAA and as we will better see in the paragraph dedicated to this type of phenomena. In other areas of the planet, a decrease in the same phenomena is observed and in still others no trend is observed, essentially bringing the global evaluations to a substantial temporal invariance.
Concerning the apparent increase in economic damage caused by extreme events, once again the IPCC [8] takes a very cautious position, arguing that the increase in the exposure of people and economic resources has been the main cause of the long-term increase in economic losses due to weather and climate disasters. Long-term trends in disaster losses, normalized to account for rising wealth and population, have not so far been attributed to climate change, but it has not so far been ruled out that climate change may have played a role.
A detailed study on the correlation between vulnerability and wealth [9] concludes that “Results show a clear decreasing trend in both human and economic vulnerability, with global average mortality and economic loss rates that have dropped by 6.5 and nearly 5 times, respectively, from 1980–1989 to 2007–2016. We further show a clear negative correlation between vulnerability and wealth, which is strongest at the lowest income levels”.
In the following paragraphs, some of the most significant extreme climate events will be considered and their trend over time on a global scale, or in those areas where the time series relating to such phenomena are considered sufficiently reliable, will be analysed.
2.1 Hurricanes
A tropical cyclone (Alias hurricane) is a rapidly rotating storm originating over tropical oceans from where it draws the energy to develop. It has a low-pressure centre and clouds spiralling towards the eyewall surrounding the “eye”, the central part of the system where the weather is normally calm and free of clouds. Its diameter is typically around 200–500 km, but can reach 1000 km. A tropical cyclone brings very violent winds, torrential rain, high waves and, in some cases, very destructive storm surges and coastal flooding. The winds blow counter clockwise in the Northern Hemisphere and clockwise in the Southern Hemisphere. Tropical cyclones above a certain strength are given names in the interests of public safety. Over the past 50 years, almost 2000 disasters have been attributed to tropical cyclones, which killed several hundred thousand people and caused more than US$ 1400 billion in economic losses [10].
The effect of hurricanes on global circulation is relevant as highlighted by studies showing a significant reduction of the Gulf Stream flow given by hurricanes passing over it [11].
These observations referred to North Atlantic in 2017 are paramount important because 80–100 tropical storms are observed worldwide each year and about half of these reach hurricane strength and a smaller percentage, about a quarter, become strong hurricanes.
The generic term “tropical cyclone” can be used to describe tropical storms, hurricanes and typhoons. While most tropical cyclones complete their life cycles without affecting land, each year many cause catastrophic damage and loss of life to coastal nations, including the USA.
Historically, around 60% of all economic damages caused by disasters worldwide is the consequence of hurricanes in the USA [12], and more than 80% of this damage comes from major hurricanes. It is therefore not surprising that hurricanes grab interest and attention. Due to their frightening destructive potential, it is also not surprising that hurricanes are a central element in the debate on climate change mitigation and adaptation policies.
To date, global observations do not show any significant trends in both the number and the energy accumulated by hurricanes, as shown in Fig. 1 and as claimed in several specific papers [13] for the USA, which report the trend dating back to over 160 years ago, or for other regions of the globe [14, 15].
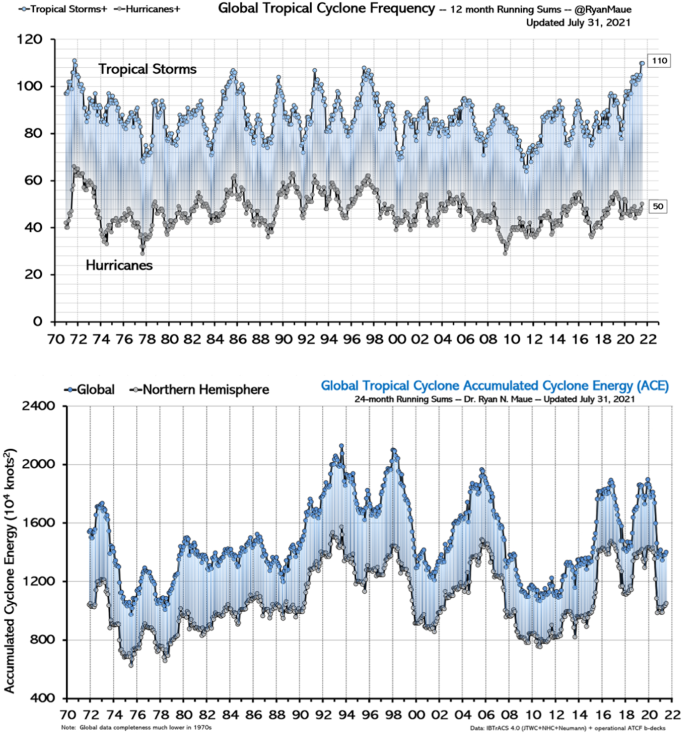
Historical trend of the Tropical Cyclone frequency (above) and accumulated energy ([16]; updated data from http://climatlas.com/tropical/)
Particular attention should be paid to the IPCC statement which reports strong increase in the frequency and activity of tropical cyclones in the North Atlantic. To get more information on this issue, NOAA [17] analysed much longer time series (> 100 years) of Atlantic hurricane activity.
Existing records of past Atlantic tropical storms or hurricane numbers (from 1878 to present) indeed show a pronounced upward trend; however, the density of Atlantic shipping reports was relatively low during the first decades of this period: if the storms of the modern era (after 1965) had hypothetically occurred during those decades, a considerable number of storms probably would not have been observed by the naval observation network.
Therefore, after adjusting the time series to take into account the smaller observational capacities of the past, there remains only a small nominally positive upward trend of the tropical storms from 1878 to 2006. Statistical tests indicate that this trend is not significantly distinguishable from zero.
Furthermore, Landsea et al. [18] noted that the rising trend in Atlantic tropical storm counts is almost entirely due to the increase in only short-lived storms (< 2 days), which were most likely overlooked in the early parts of the record, as they would have had less opportunity for casual encounters with ship traffic.
If we look at hurricanes in the Atlantic basin, rather than all tropical storms, the result is similar: the reported number of hurricanes during the 1860s and 1880s was similar to nowadays and again there is no significant positive trend since that time. Evidence of an upward trend is even weaker for hurricanes hitting the coast of the USA, which show a slightly negative trend starting in the 1900s or late 1800s.
The situation for the various long-term Atlantic hurricane records and related indices is summarized in Fig. 2 [17]: while the tropical Atlantic mean temperature and SSTs show pronounced and statistically significant warming trends (green curves), the record of hurricanes that hit the coast in the USA (orange curve) shows no significant trend. The uncorrected hurricane count record (blue curve) shows a significant increase in Atlantic hurricanes since the early 1900s. However, when adjusted with the estimate of storms remaining at sea and likely “missed” in the pre-satellite phase, there is no significant increase in Atlantic hurricanes since the end of the nineteenth century (red curve).
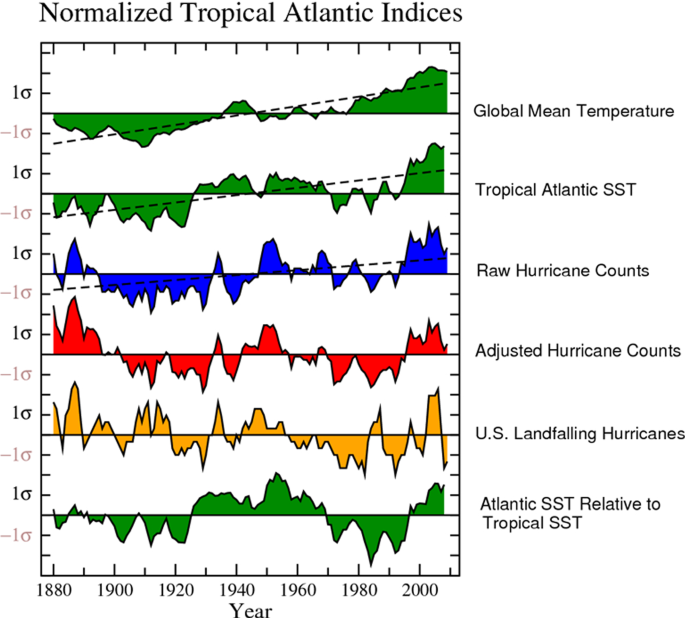
Historical trend of the normalized indicators of the Atlantic tropical zone from 1880 to today
Although there have been increases in hurricanes hitting the coast of the USA and in hurricane counts in the Atlantic basin since the early 1970s, Fig. 2 shows that these recent increases are not representative of the observed behaviour in century-long records. In short, the historic record of Atlantic hurricane frequency does not provide convincing evidence of a substantial long-term warming-induced increase.
NOAA therefore concludes that “it is premature to conclude with high confidence that increasing atmospheric greenhouse gas concentrations from human activities have had a detectable impact on Atlantic basin hurricane activity” [17].
Regardless of scientific ability to draw conclusions about the effects of climate change on hurricanes, we can be sure that hurricanes will continue to occur and devastate coastal regions. The only proven and practical way to prevent loss of life and property damage is to introduce appropriate building standards and maintain a high level of vigilance for such phenomena.
2.2 Tornado
A tornado [20] is a vortex extending upward from very near the surface at least as far as cloud base (with cloud base associated with deep moist convection, typically a cumulonimbus cloud), that is intense enough at the surface to do damage.
The enhanced Fujita scale (or abbreviated as EF-Scale) rates the intensity of tornadoes in six categories from zero to five [21]. Both multicell and supercell thunderstorms are able to produce tornadoes but supercells are far the most dangerous: more than 20% of supercell tornadoes are potentially capable of causing catastrophic EF-4/EF-5 damage [22].
The USA have a very long tornado time series that is suitable for trend analysis. As reported on the authoritative NOAA website [19, 23] and also reiterated by the IPCC in its reports [8], one of the main difficulties related to tornadoes is that an event can be inserted in a time series of tornadoes only if it has been directly observed or if traces of its passage have been observed (they leave impressive traces of torsion on roots and tree crowns or road signs). Tornadoes have a very short duration and are essentially unpredictable; therefore, if a tornado occurs in an uninhabited location it is unlikely to be documented: it is then likely that many significant tornadoes in the USA were undetected as the area affected by their trajectories was sparsely populated during the early part of the century.
With increased Doppler radar coverage, population growth and increased attention to tornado reports, there has been an increase in the number of tornado reports in recent decades. This can create the misleading appearance of a growing frequency of tornadoes.
However, by consulting the time series shown in Fig. 3 [24], we realize that the increase in the number of tornadoes since 1950 is almost entirely due to weak events (EF0-EF1 in the advanced Fujita scale), those that in the past in many cases escaped the observation and which today are more easily identified thanks to a wide range of systems ranging from cell phone cameras to satellites and Doppler radars. In contrast, strong to violent tornadoes (categories EF-3 to EF-5 on the advanced Fujita scale), likely reported also before the Doppler radar era, show no increase over time.
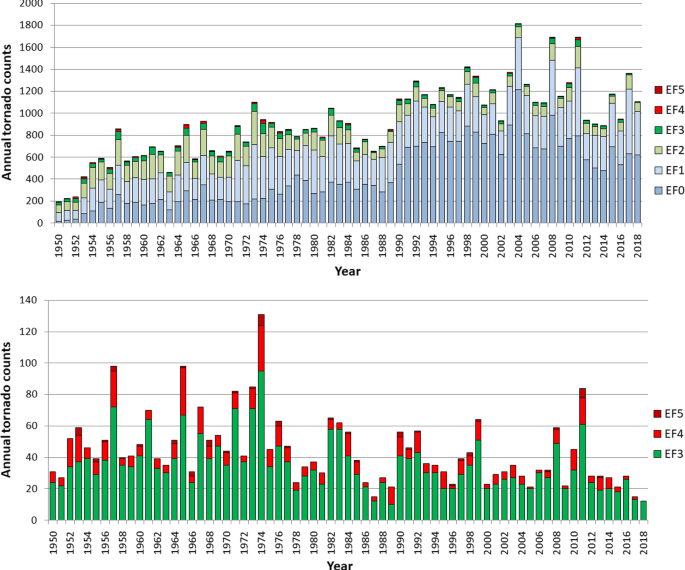
Source: NOAA data plotted using the layout proposed by [24])
Annual count of all tornadoes (top) recorded in the USA and (bottom) only the strongest ones. (
When asked if climate change pushes to influence the occurrence of tornadoes, NOAA says that at the moment it is not possible to give an answer and that more research is needed as these events occur on very small scales, which makes observations and modelling challenging.
Projecting the future influence of climate change on these events can also be complicated by the fact that some of the risk factors may increase with climate change, while others may decrease.
This is because tornadoes are meteorological phenomena of very short duration, placing themselves on time scales of seconds and minutes and on reduced spatial scales. On the contrary, climate trends unfold their effects over much wider time spans (years, decades or millennia) and affect large areas of the globe.
In addition, climate models are unable to resolve tornadoes or single thunderstorms. They may indicate large-scale changes in three of the four ingredients conducive to severe thunderstorms (humidity, instability and wind shear), but having some favourable factors in place does not guarantee tornadoes. Our physical understanding points to mixed signals: some ingredients can increase (instability), while others can decrease (wind shear), in a warmer world. The other key ingredient (storm lift) and, to varying degrees, humidity, runaway and wind shear, depend primarily on daily patterns and often on local minute-by-minute weather as well.
The Clapeyron equation tells us that global warming ascertained with thermometers (increase in global air temperature two metres above the ground by 7 tenths of a degree per century) results in a higher atmospheric content of water vapour gas, but it is difficult to put this increase in relation with convective phenomena or more generally with the global maps of precipitation intensity and with the trend of the glaciers, which variability over decades is the effect of a large number of factors.
2.3 Global precipitation and extreme precipitation events
Precipitation is a key segment of energy and matter cycle of our planet [25]. In fact water evaporated from oceanic surfaces and transpired by land vegetation absorbs large amounts of energy in the form of latent heat and is a fundamental carrier for zonal and meridional transport of energy [26]. Moreover, water vapour is the main greenhouse gas being responsible of the 51% of the whole greenhouse effect of our planet [27]. In this context, precipitation releases the energy carried by the atmosphere and at the same time modulates the greenhouse effect acting on the residence time of water vapour in the atmosphere [28].
Global observational datasets indicate an increase in total annual precipitation which appears at first sight consistent with the increase in global temperatures and the consequent increase in precipitable water stored in the atmospheric reservoir. To support this judgement, the global precipitation yearly time series 1901–2018 from the gridded land-based precipitation Hadex3 dataset [29] derived from daily, in situ observations were analysed: the diagram in Fig. 4 shows that global rainfall is increasing since about 1970.
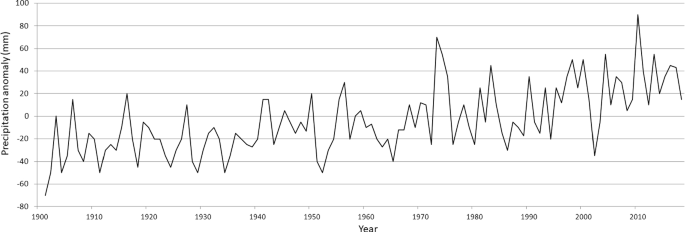
Global yearly precipitation anomaly (difference in mm from the 1961–1990 average). Processing carried out on data from Hadex3 dataset [29]—figure S27 of supplementary materials
Given this increase in total annual precipitation, it is important to ask whether it has translated into an increase in extreme precipitation events with an effect similar to that recorded for the heatwaves which increased in frequency due to the increase in global temperatures. For this aim, it is important to state that there are many possible definitions for extreme precipitation events, from return periods and peaks-over-threshold approaches, to indices that capture duration or intensity. In addition, extremes can also be defined over a wide range of spatial and temporal scales [30]. Our analysis will mainly focus on daily maximum rainfall for land stations seen globally and for large regions, because (1) sub-daily data are often too short or of insufficient quality and (2) changes in the magnitude of sub-daily extremes emerge more slowly than those for daily extremes as stated by Barbero et al. [31] which carried out an analysis on the trends of daily and hourly extreme rainfall on a large network of stations across the USA within the 1950–2011 period.
For a correct interpretation of extreme precipitation data, it is also necessary to take into account that their accurate detection is highly dependent on the accuracy of rainfall measurements. Analysing the effects on the accuracy of the measurements goes beyond this work, but it should be considered in the analysis and yet the data quality remains a concern because precipitation measurements are difficult to homogenize given their high spatial and temporal variability. Data are then likely not free of inhomogeneities coming from changes in the type of instrumentation used to measure precipitation, since different rain gauges have different wind under catch, wetting losses and evaporation losses [32, 33]. In addition, the sensor of automatic (mechanical or electronic) rain gauges is a rocker equipped with two cups that are filled alternately with water and poured out. The rocked can be stopped by a wide range of phenomena such as the accumulation of dirt or the presence of insects nests. In this case, a value of 0 is reported even in the presence of rain, which makes the instruments intrinsically inaccurate.
Regarding the intensity of extreme daily precipitation events, Papalexiou and Montanari [34] analysed the extreme precipitation events over 1964—2013 on a total of 8730 stations. The analysis shows an increase in intensity in 12.9% (between 11.7 and 13.9%) of stations globally and a drop in 9.8% (between 9 and 11.4%), while 77.3% of stations do not show significant trends.
These data substantially confirm those presented by Westra et al. [35], who analysed trends in global one-day maximum annual precipitation for the period 1900 to 2009 (110 years in all). The work, related to a total of 8326 ground stations that the researchers considered to be of “high quality”, led to the conclusion that about 2% of the stations show a decrease in extreme rainfall, 8% an increase and 90% has no trend.
The results of this analysis were recently confirmed by the results on one-day maximum annual precipitation presented by the same group of researchers [32] that are referred to the period 1950–2018 and highlight that:
-
For the period 1950–2018, 9.1% of stations show a statistically significant increasing trend, which is much higher than could be expected from random chance alone. In contrast, the percentage of stations showing a statistically significant decreasing trend is only about 2.1%, comparable with what one would expect from random chance
-
For the Mediterranean area, only 4.7% of stations show a statistically significant increasing trend, while 3.8% show a significant decreasing trend (Fig. 5)
-
Northern Europe shows the highest excess worldwide of stations with positive trends (14.4%) compared to those with negative trends (1.2%) (Fig. 5).
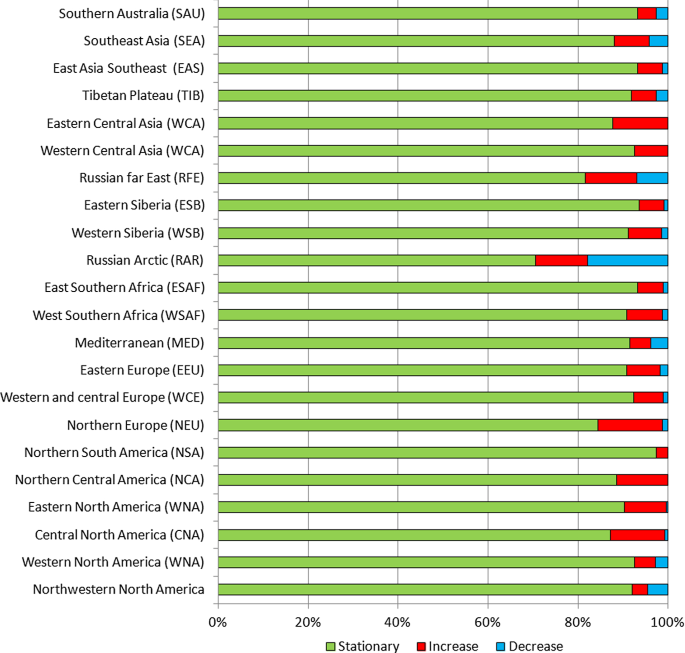
Percentage of stations with stationary, statistically significant increasing and statistically significant decreasing trends in annual maxima of 1-day precipitation based on the Mann–Kendall test during the 1950–2018 period. Processing carried out on data from [32]
Results for Northern Europe and the Mediterranean area are consistent with the current climate phase which is characterized by positive NAO values which determine an intensification of the Westerlies that bring frontal systems on Northern Europe [36] while the Mediterranean should be less affected by storm tracks.
The stationary results highlighted by Sun et al. [32] for the Mediterranean are also confirmed for the Italian area by more detailed investigations conducted by Libertino et al. [37] where maximum rainfall for 1-, 3-, 6-, 12- and 24-h durations limited to the period 1928–2014, where at least 50 stations are simultaneously active each year, is considered. Only time series with at least 30 years of either continuous or noncontinuous data have been selected, resulting in 1,346 stations. The conclusions from this work are that “Concerning the frequency, the outcomes show that all the observed trends are nonsignificant, that is, are compatible with the hypothesis of stationary climate.[…]. With regard to the intensities of the events, a clear trend in extreme rainfall magnitude cannot be detected at the country scale”.
The work cited for Italy, which is the area of the world best known to the authors, is particularly interesting as they analysed daily or hourly datasets collected by the Hydrographic Service of the Ministry of Public Works, which collected data homogeneously on the entire National territory. This service was unfortunately abolished in 1998 and its competences were transferred to the regions thus generating 20 regional networks each with its own standard. We cite this example because it seems emblematic to us of the tendency to multiply operational measurement networks, giving rise to increasingly relevant levels of inhomogeneity. This is exactly the opposite of what one would need if one were really worried about the current trends in the climate that would lead to having homogeneous networks on the entire world territory in analogy with what has been done in the case of the monitoring of the oceans with the ARGO buoy system.
Our review shows that while an increase in total annual precipitation is observed on a global level, an increase in extreme precipitation is observed for a limited number of stations and with strong regional differences. The absence of generalized growth trends in extreme precipitation can be explained by the fact that the genesis of extreme precipitation requires (1) the presence of a relevant source of moisture in the boundary layer, (2) morphology of the relief, circulatory structures at different scales and vertical thermal profile favourable to the rising of air mass with development of clouds of sufficient thickness (e.g. cumulonimbus and nimbostratus clouds) and (3) microphysical characteristics of cloud environment favourable to magnify droplets or ice crystals to give precipitation.
2.4 Floods and droughts
Floods and droughts are important indicators of response to changes in precipitation regimes.
About floods it can be said that although evidence of an increase in total annual precipitation is observed on a global level, corresponding evidence for increases in flooding remains elusive and a long list of studies shows little or no evidence of increased flood magnitudes, with some studies finding more evidence of decreases than increases [38,39,40,41,42,43,44,45,46].
Some reasons of the decrease in flood magnitudes are listed by Sharma et al. [47] which identify decreases in antecedent soil moisture, decreasing storm extent and decreases in snowmelt among the possible responsible mechanisms.
It may be interesting to recall the results obtained in the historical context for the European area, where various paleo-hydrological studies show that the alluvial events frequency in Europe was significantly lower during the warm phases (e.g. Roman optimum and medieval optimum) than during the cold ones (e.g. Little Ice Age) as attested, for example, by Wirth et al. [48] who worked on Central Alps data. This evidence is supported also by the article signed by a large group of historical climatologists, including the Italians Bertolin and Camuffo [49], where the following statement is reported «recent changes in the variability of flood frequencies are not exceptional if compared to the flood frequency of the past 500 years and show no overall trend similar to the widely cited “hockey-stick” trend for temperatures. There is a similar conclusion drawn by the SPHERE project which for north-east Spain has shown that events during the last 400 years produced discharges significantly greater than the biggest gauged flood events of modern times. Hence, the study of historical floods permits a more comprehensive risk analysis to be undertaken and appropriate flood protection to be planned».
The evidence of more flood events during the Little Ice Age is also confirmed by Wilhelm et al. [50], who examine floods in the Mediterranean French Alps over the past 1400 years and find that extreme rainfall and flooding are less common and less extreme during warm periods than in cold periods. More specifically, the authors find a low frequency of floods during the medieval warm period and more frequent and intense events during the little ice age.
Yiou et al. [51], analysing the trends of river floods in Bohemia for the Elbe and Vltava rivers, showed that the trend of both frequency and intensity is generally decreasing in the twentieth century. The nineteenth century was far more exposed to these phenomena than the twentieth century and the recorded events are unmatched in the second millennium. Similar conclusions were reached by Mudelsee et al.[52, 53] for Elba and Oder in Germany.
Diodato et al. [54] reconstructed the Damaging Hydrological Events (DHE) in Italy for the period October–April, highlighting that during the medieval warm period DHE were less frequent while more frequent and intense events prevailed during the little ice age (LIA). Finally, starting from the mid-nineteenth century with the exit from the LIA, a decline of DHE has been observed, especially during the last few decades.
Again for Italy, an article by Taricco et al. [55] reconstructs the flow rates of the Po river in the last 2200 years, highlighting very low flow rates up to 1100, very high flow rates during the LIA with a maximum around 1500 and a subsequent decrease in flow rates after 1850.
In conclusion, although evidence of an increase in total annual precipitation is observed on a global level, this does not translate into an increase in intensity or frequency of floods. Similar conclusions seem to be reached by the draft of AR6 available today.
Drought is a complex phenomenon which is difficult to monitor and define. Depending on the variables used to characterize it and the systems or sectors being impacted, drought may be classified in different types such as meteorological (precipitation deficits), agricultural (e.g. crop yield reductions or crop failure, related to soil moisture deficits), ecological (related to plant water stress that causes e.g. tree mortality) or hydrological droughts (e.g. water shortage in streams or storages such as reservoirs, lakes, lagoons and groundwater).
The IPPC in its AR5 [6] reports on page 44 that “conclusions regarding global drought trends increasing since the 1970s are no longer supported” and several studies indeed show no increase in the main indices regarding global drought [56, 57].
Hao et al. [58] analysed the time series relating to the period 1982–2012 of the Global Integrated Drought Monitoring and Prediction System (GIDMaPS) that uses three drought indicators for monitoring and prediction: the Standardized Precipitation Index (SPI), Standardized Soil Moisture Index (SSI) and Multivariate Standardized Drought Index (MSDI). SPI and SSI are indicators of meteorological and agricultural drought, respectively. The authors highlight the downward trend in the percentage of land area affected by drought, as shown in Fig. 6.
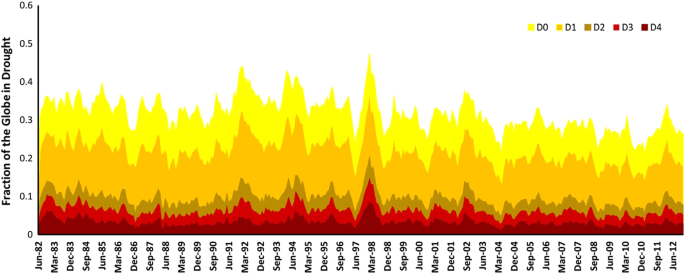
Fraction of the global earth under drought conditions D0 (abnormally dry), D1 (moderate), D2 (severe), D3 (extreme) and D4 (exceptional) [58]
Similar conclusions seem to be reached about meteorological and hydrological drought by the IPCC AR6 draft available today, while a little more concern is expressed about agricultural and ecological drought.
Kogan et al. [59] analysed global trends in agricultural drought using the satellite-based Vegetation Health (VH) method for the period 1981–2018. Their results show that for the entire globe, hemispheres and the main grain-producing countries (China, USA and India) drought has not intensified and expanded during 38 year, while the global temperature anomaly has increased. The conclusion of the authors is that since drought has not intensified and expanded during recent global warming, food security in the next few years is likely to remain at the level of the most recent decade.
A factor of significant importance to agricultural drought, which is often neglected in the analyses, is the fact that the crop water consumption is directly proportional to the quantity of the final product: corn needs 370–910 kg of water for every kg of grain produced, wheat 590–1700 and rice 635–1700 depending on the variety [60]. It can then be easily deduced that since global yields of maize, wheat, rice, soybean and barley have on average increased by 217–297% from 1960 to today (see next paragraph) and since the acreage area has been stable for about 50 years around 1.5 billion hectares, the crop water consumption also followed a similar increase.
Concerning the ecological drought, two contrasting phenomena acting on water consumption of natural vegetation should be considered:
-
Increases at medium–high latitudes due to the lengthening of the growing season due to global temperature increase [61]
-
Decreases in a generalized way due to higher co2 levels: an increase in atmospheric co2 concentration levels reduces the number of stomata per unit leaves area (stomatal index) and induces stomatal closure, which reduces plant water consumption [62].
In conclusion, we believe that there is no evidence that the areas affected by the different types of drought are increasing.
3 Global greening and global agricultural production
Productivity of natural ecosystems is a relevant indicator of response to changes in meteorological variables (temperature, precipitation, global solar radiation, etc.). From this point of view, it can be said that global plant biomass has changed significantly in recent decades with a phenomenon known as global greening which indicates the significant increase in productivity of ecosystems (agricultural and natural) that in recent decades was mainly highlighted by satellite monitoring [63]. The review of Walker et al. [64] stated that at the roots of this global phenomenon is the increase of atmospheric CO2 concentration that is increasing leaf-scale photosynthesis and intrinsic water-use efficiency. The direct response to these phenomena is the increase in plant growth, vegetation biomass and soil organic matter. The final effect is a transfer of carbon from the atmosphere into terrestrial ecosystems carbon sink, which can slow the rate of atmospheric CO2 growth.
Satellite data show “greening” trends over much of the planet [65, 66] that are pushing back deserts around the world (both hot deserts of tropical latitudes and cold deserts of more northern latitudes). The relevance of the greening is confirmed by Campbell [67] which using carbonyl sulphide records as a proxy of photosynthetic activity, showed a 31% increase in gross primary production during the twentieth century. Moreover, Wang et al. [68] analysed the global ecosystem productivity for the period 1982–2016 and showed that the most relevant positive anomalies are recorded in coincidence with abundant precipitation showing the importance of water limitation for ecosystem productivity.
It should also be noted that Zeng et al. [69], using a terrestrial carbon cycle model, showed that agriculture is responsible of about the 50% of the increased absorption of CO2, which shows its essential eco-systemic role. In fact, agriculture emits only a small fraction of what it previously absorbed with photosynthesis. Agriculture each year absorbs 7.5 GT of carbon which rises to 12 GT if we also consider pastures [70] while the overall emissions of the agricultural sector amount to 1.69 ± 0.38 GT [71]. Consequently, agriculture emits 14.1 ± 0.03% of what was previously absorbed.
The global relevance of global greening was shown by the simulation carried out by an Australian research group [72] with the model CABLE (Community Atmosphere Biosphere Land Exchange) which illustrates the global trend of Gross Primary Productivity (GPP) from 1900 to 2020 as the result of (a) physiological effect of leaf level changes directly stimulated by carbon dioxide, (b) effect linked to the overall increase in leaf mass and c) effect of climate change. Overall, the increase in GPP from 1900 to 2020 is estimated to be 30% while it is estimated that it will reach 47% would CO2 double (560 ppmv).
Even if the prevailing idea is that we are facing a positive phenomenon that demonstrates the great ability of ecosystems to adapt to the variation of natural and anthropogenic forcing, we must not overlook that ecosystem CO2 responses are complex or confounded by concurrent changes in multiple agents of global change, and evidence for a CO2 driven terrestrial carbon sink can sometimes appear contradictory [64]. For example, summer soil drying is exacerbated by earlier spring greening of vegetation that raises evapotranspiration and thus lowers spring soil moisture [61].
In any case, global greening is a cultural challenge that leads us to reflect on the positive implications of the increase in the atmospheric levels of CO2. In this regard, according to the data of Campbell et al. [67] and Haverd et al. [72], in absence of greening driven by CO2 we would have a relevant decrease in agricultural production with significant negative impacts on global food security. Mariani [73] estimated a 18% decrease in corn, rice, wheat and soybeans agricultural production in the event of a return of CO2 to pre-industrial levels. However, this result was obtained with a model that does not consider the negative effects on crop yield of extreme events like droughts, rainfall excess, frost and heat waves.
On the basis of the resurgence of extreme events, changes in the rainfall regime, rising temperatures and the effect of pollutants such as ozone, the AR5 chapter 7 executive summary [6] concludes that “The effects of climate change on crop and terrestrial food production are evident in several regions of the world (high confidence). Negative impacts of climate trends have been more common than positive ones”.
However, this statement does not adequately consider the following 2 factors:
- 1
the adaptability of the global agricultural system linked to its extreme flexibility which translates into the ability to rapidly adopt innovations in genetics (new varieties more suited to the environment) and cropping techniques (irrigation, fertilization, weeding, pests and diseases management, etc.). These technological innovations are the result of the strong advances in crop science happened since the beginning of the XIX century and whose diffusion has grown strongly after the end of the Second World War [74]
- 2
the compensation effect linked to the fact that agriculture takes place over a very vast area (all continents except Antarctica) which involves two hemispheres, thus guaranteeing two harvests a year. This translates into the fact, already highlighted in the eighteenth century by Adam Smith [75] and Giovanni Targioni Tozzetti [76], that in a certain year the yield drops recorded in an area due to extreme events (drought, excessive rain, heat waves, etc.) are counterbalanced by the yield increases that occur in other areas.
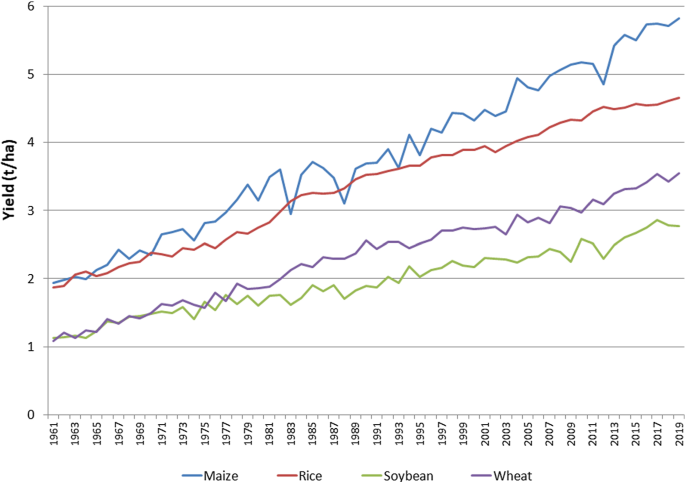
The first point is today significantly accentuated by our technological capabilities while the second one is constantly at work as shown by the increases in global agricultural production since 1870 by Federico [77] and in global yields since 1961 by the FAO time series. This is reported in Fig. 7 that shows the increase in yield per hectare recorded from 1960 to today for four crops (maize, rice, soybean and wheat) responsible for 64% of the mankind caloric intake [78].
source of data [79])
1961–2019 time series of global average yields (t/ha) for maize, rice, soybean and wheat (
We have analysed the time series of maize, rice, soybean and wheat global mean yields (t/ha) for the period 1961–2019 [79] and we have obtained a very robust positive linear trends equal, respectively, to 3.3%, 2.4%, 2.6% and 3.8% per year for the four above-mentioned crops. In our view, the main drivers of this trend are technological progress and CO2 fertilization. This linear trend was subtracted from the data, obtaining the residuals that are the expression of phenomena like extreme meteorological or meteorologically driven events (heat waves, cold outbreaks, droughts, floods and so on). The analysis of the residuals (supplementary material—Fig. S1) indicates that the deviations from the linear trend have not increased in recent years, which would lead to exclude an increase in the effects of extreme events.
“In general, an increase in temperature level favours the growth and distribution of pest species by providing a warm and humid environment and providing necessary moisture for their growth”, says Tek Sapkota, agricultural systems and climate change scientist at the International Maize and Wheat Improvement Center (CIMMYT).
However, when temperatures and precipitation levels get too high, this can slow the growth and reproduction of some pest species and destroy them by washing their eggs and larvae off the host plant, he explains.
4 CRED data
Finally, we propose a different point of view by taking into consideration the historical series of natural disasters as reported in the EM-DAT dataset of the CRED (Center for Research on the Epidemiology of Disasters) of the Catholic University of Louvain in Belgium.
In order to be recorded in this dataset, an event must have one or more of the following characteristics:
-
100 or more people affected by the event
-
10 or more people died as a result of the event
-
Declaration of state of emergency
-
Request for international assistance
Clearly, other factors come into play besides the intensity of the event taken into consideration, such as the ability to prevent or protect yourself from the event itself; however, a look at this statistic can give useful information on the evolution of extreme events.
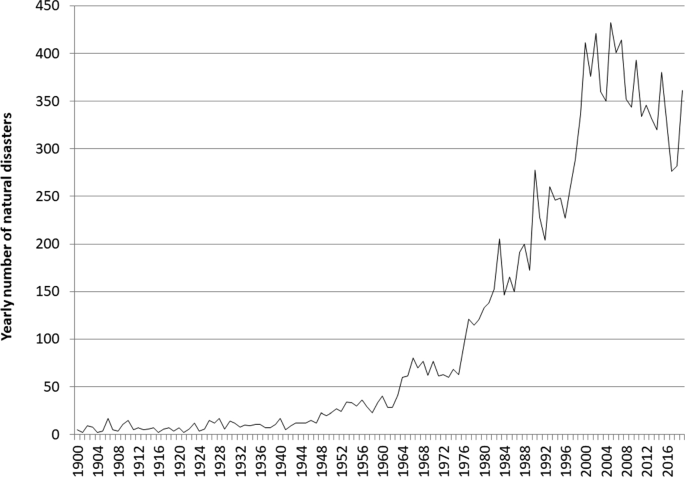
Looking at natural disasters since 1900 shown in Fig. 8, a very small number can be observed since the middle of the last century, when a sudden growth begins which stops towards the end of the twentieth century to give way to a trend marked by a slight decrease. This trend is very strange: is it possible that natural disasters essentially appeared towards the middle of the twentieth century and that they showed such dramatic growth until the end of the century? It should also be noted that this trend is at first sight “consistent” with the growth of the global temperature of the planet.
(source: CRED dataset—https://ourworldindata.org/)
Diagram of the number of natural disasters from 1900 to today
In several reports, however, CRED warned about an exclusively climatological interpretation of the increase in events observed until the end of the twentieth century: in 2004 CRED wrote [80] that their time series (Fig. 8 with data up to 2003) “might lead one to believe that disasters occur more frequently today than in the beginning of the century. However, reaching such a conclusion based only on this graph would be incorrect. In fact, what the figure is really showing is the evolution of the registration of natural disaster events over time”.
Again in 2007 [81]“Indeed, justifying the upward trend in hydro-meteorological disaster occurrence and impacts essentially through climate change would be misleading. … one major contributor to the increase in disasters occurrence over the last decades is the constantly improving diffusion and accuracy of disaster related information”.
And this indication has been maintained over the years [82] “From a disasters analysis point of view, population growth and patterns of economic development are more important than climate change or cyclical variations in weather when explaining this upward trend. Today, not only are more people in harm’s way than there were 50 years ago, but building in flood plains, earthquakes zones and other high-risk areas has increased the likelihood that a routine natural hazard will become a major catastrophe”.
In support of this interpretation, there is also the growth of earthquakes, shown in Fig. 9, which should have nothing to do with global warming and which presents a temporal trend similar to that of all other natural disasters.
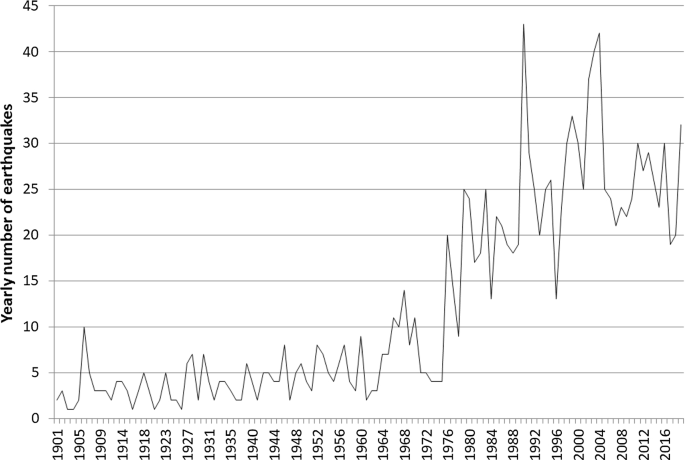
source: CRED dataset—https://ourworldindata.org/)
Diagram of the number of earthquakes from 1900 to today (
In our opinion, this confirms that the main reason of the increase in the second half of the twentieth century is the growing reporting capacity of individual states and that since this capacity has stabilized on a reliable level, the number of disasters has become stationary or has even gone down. It is the same phenomenon already observed for hurricanes and tornadoes. Moreover, reporting has improved because civil protection systems have reached higher organizational levels in many parts of the world; at the same time, the levels of interconnection with international organizations have improved and this should be highlighted as a positive element.
5 Conclusions
From the Second World War, our societies have progressed enormously, reaching levels of well-being (health, nutrition, healthiness of the places of life and work, etc.) that previous generations had not even remotely imagined. Today, we are called to continue on the path of progress respecting the constraints of economic, social and environmental sustainability with the severity dictated by the fact that the planet is about to reach 10 billion inhabitants in 2050, increasingly urbanized.
Since its origins, the human species has been confronted with the negative effects of the climate; historical climatology has repeatedly used the concept of climate deterioration in order to explain negative effect of extreme events (mainly drought, diluvial phases and cold periods) on civilization. Today, we are facing a warm phase and, for the first time, we have monitoring capabilities that enable us to objectively evaluate its effects.
Fearing a climate emergency without this being supported by data, means altering the framework of priorities with negative effects that could prove deleterious to our ability to face the challenges of the future, squandering natural and human resources in an economically difficult context, even more negative following the COVID emergency. This does not mean we should do nothing about climate change: we should work to minimize our impact on the planet and to minimize air and water pollution. Whether or not we manage to drastically curtail our carbon dioxide emissions in the coming decades, we need to reduce our vulnerability to extreme weather and climate events.
Leaving the baton to our children without burdening them with the anxiety of being in a climate emergency would allow them to face the various problems in place (energy, agricultural-food, health, etc.) with a more objective and constructive spirit, with the goal of arriving at a weighted assessment of the actions to be taken without wasting the limited resources at our disposal in costly and ineffective solutions. How the climate of the twenty-first century will play out is a topic of deep uncertainty. We need to increase our resiliency to whatever the future climate will present us.
We need to remind ourselves that addressing climate change is not an end in itself, and that climate change is not the only problem that the world is facing. The objective should be to improve human well-being in the twenty-first century, while protecting the environment as much as we can and it would be a nonsense not to do so: it would be like not taking care of the house where we were born and raised.